

.png)

Task 1: The graph gives information about coffee production in 4 different countries from 1990 to 2010.—ĐỀ THI 30/4/2020
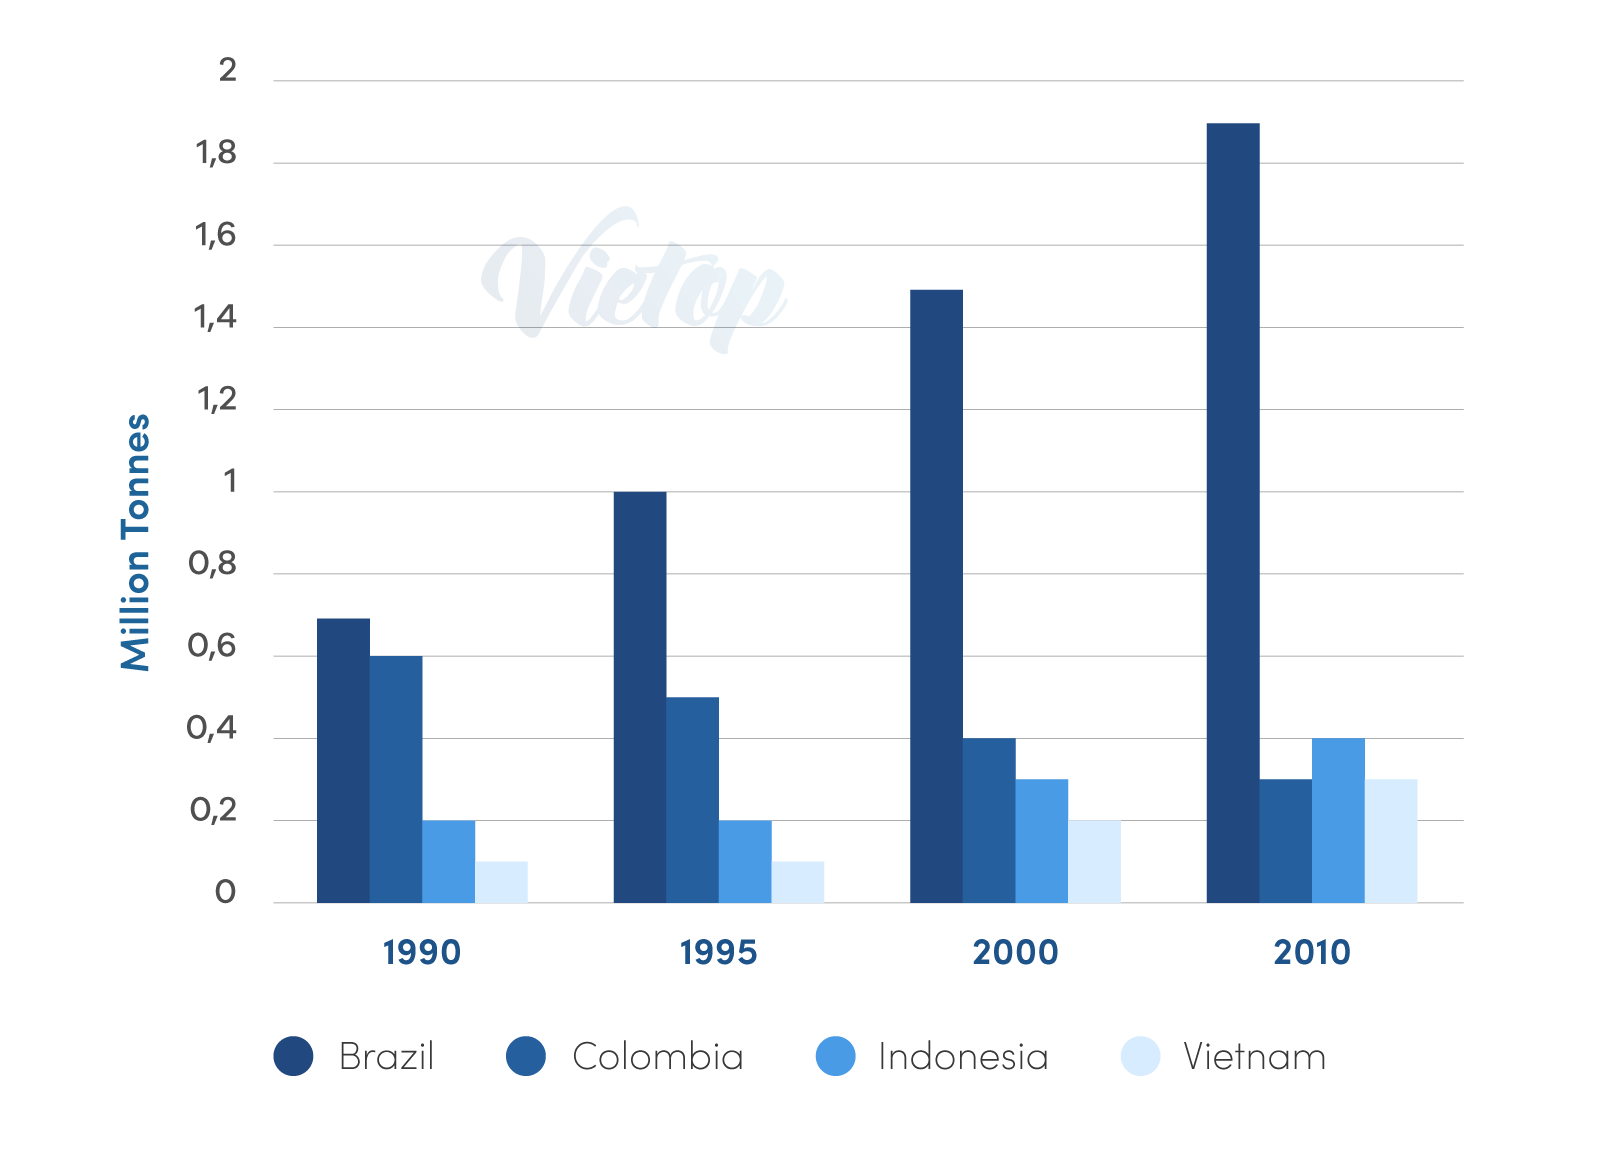
The exhibited bar chart delineates four distinct countries, namely Brazil, Colombia, Indonesia, and Vietnam in terms of the amount of coffee produced over a period of three decades, starting from 1990. Units are measured in millions of tonnes.
Looking at the bar chart, it is clearly seen that the productions of Brazil, Indonesia, and Vietnam increased dramatically over the period shown while Colombia experienced a downward trend in its statistics. It is noticeable that the amount of coffee manufactured by Brazil was the highest figure. Besides, the lowest figure on the chart was for Vietnam from 1990 to 2010.
In 1990, Brazil’s coffee production started at approximately 0.7 M which was three times higher than that of Indonesia, at roughly 0.2 M. In addition, the coffee production in the UK stood at about 0.1 M. The period 1990 – 2010 saw a significant increase in the amount of coffee generated by Brazil, and upward tendencies were also seen in Indonesia, and Vietnam. In 2010, the amounts of coffee made by Brazil, Indonesia, and Vietnam reached nearly 1.9, 0.4, and 0.3 respectively.
Conversely, over the period from 1990 and 2010, Colombia experienced a significant decrease in its coffee production. In 1990 the amount of coffee produced by Columbia started at just about 0.6 M, and then the figure for it in 2010 hit the lowest point at roughly 0.3 M.